
Cardinal
Know your SQL's true shape.
Was your SQL Server installed with "next-next" and then forgotten? Cardinal finds what is slowing it down without touching the server — reading metadata only — produces a 0–100 health score and gives concrete advice like "rewrite this query this way and you get ~21 minutes back per day."
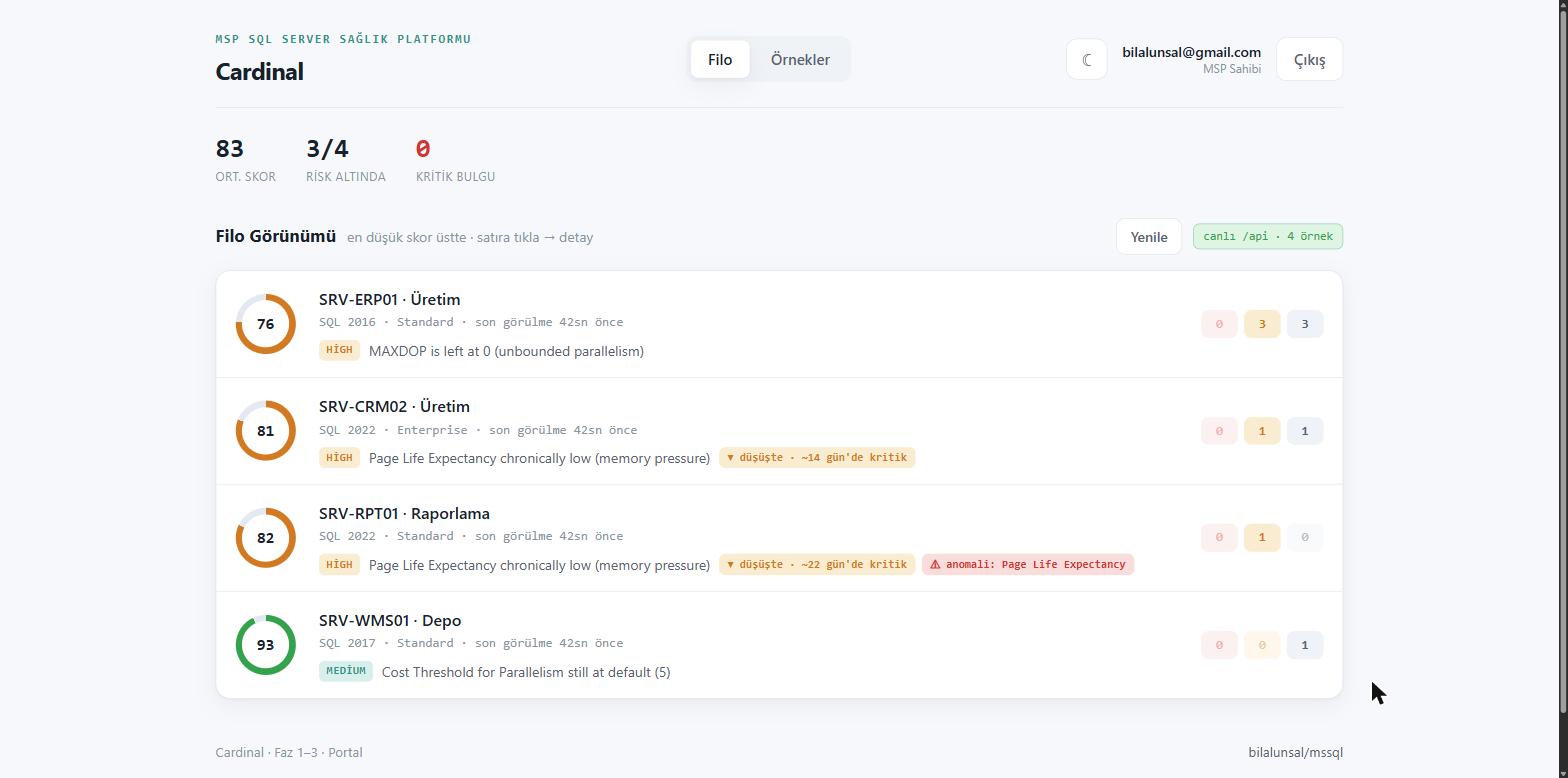
What is Cardinal? Cardinal is a monitoring and advisory platform that listens to Microsoft SQL Server instances and produces performance findings, prioritised recommendations and a 0–100 SQL Health Score. It is developed by Bilgi Teknoloji Danışmanlık.
The observation plane runs out-of-band: it reads metadata only (DMVs, Query Store, configuration) with a least-privilege account and never touches your user tables. Its output is a findings list, server-specific remediation T-SQL and query rewrite recommendations — in the portal and in a client-ready PDF report.
We don't just show the problem — we write the fix
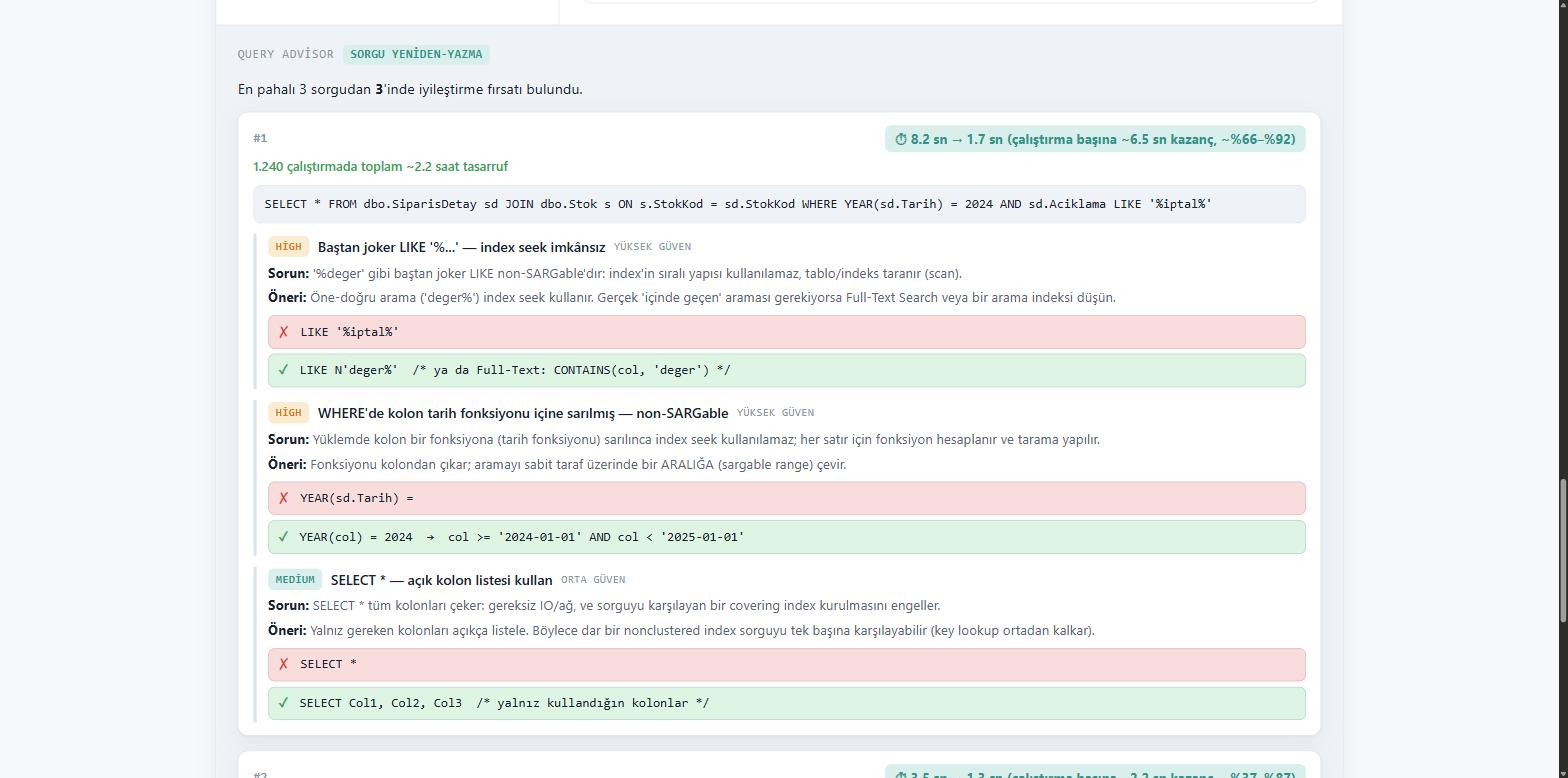
Monitoring tools say "this query is slow." Query Advisor says "write it like this" — with a before → after snippet, the reason, and a time estimate.
SELECT * FROM dbo.SiparisDetay sd
JOIN dbo.Stok s ON s.StokKod = sd.StokKod
WHERE YEAR(sd.Tarih) = 2024
  AND sd.Aciklama LIKE '%iptal%'
SELECT sd.SiparisNo, sd.StokKod, s.StokAd
FROM dbo.SiparisDetay sd
JOIN dbo.Stok s ON s.StokKod = sd.StokKod
WHERE sd.Tarih >= '2024-01-01'
  AND sd.Tarih <  '2025-01-01'
  AND sd.Aciklama LIKE N'iptal%'
Three separate findings combined: the leading-wildcard LIKE blocked an index seek, the date function in the WHERE clause made the column non-SARGable, and SELECT * made a covering index impossible.
14 anti-pattern detectors
Static analysis. Query Advisor works on collected query text and DMV statistics; it never executes a live query plan. Every recommendation carries a confidence level (high / medium).
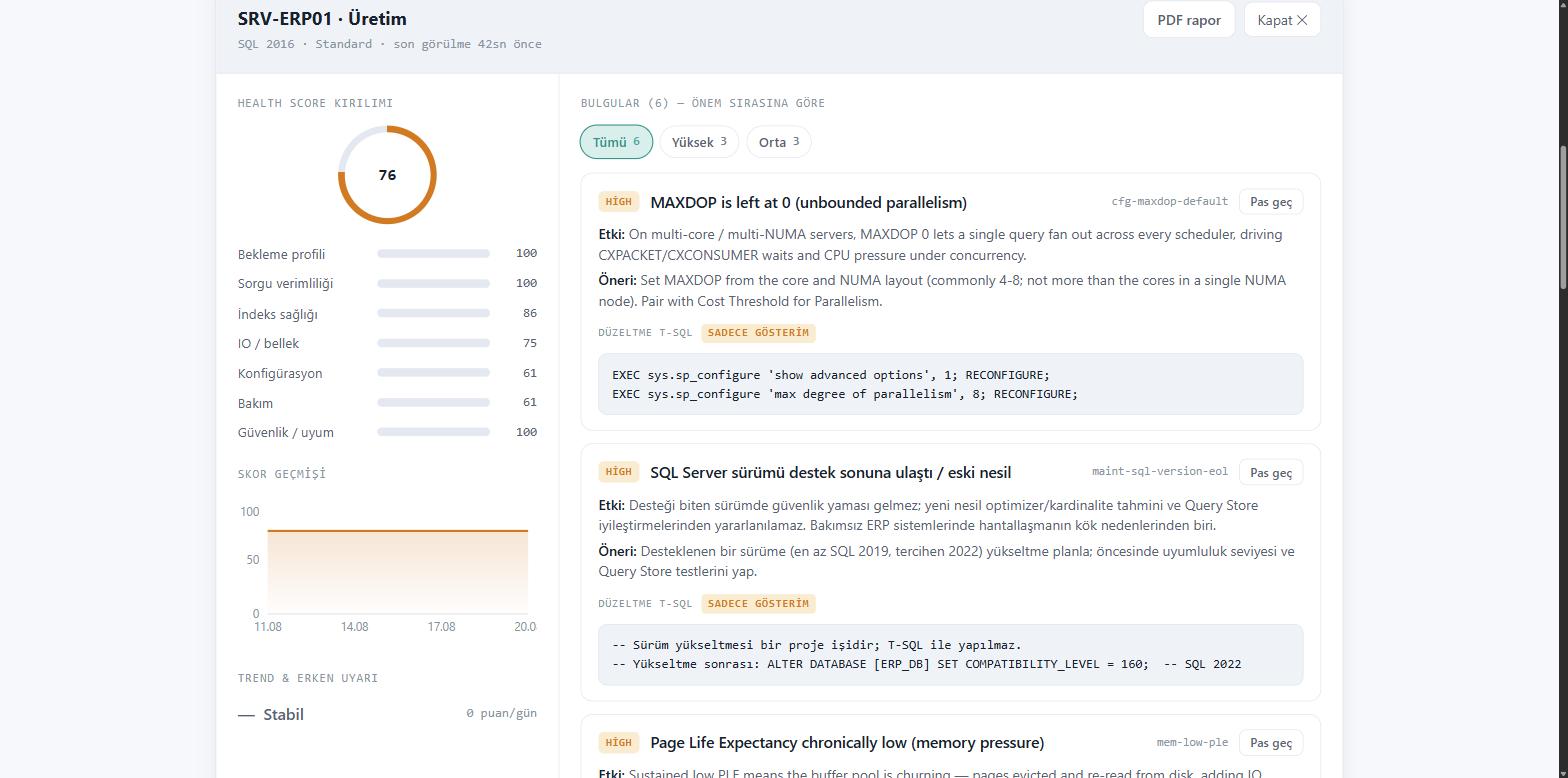
Seven categories, fifty rules, one number
The score is not a blunt gate: every fix you apply moves the number. At a real customer it went 74 → 75 → 77 → 78 → 81, then 92 once the last high finding cleared.
- 50 declarative rules
Rules are data, not code (JSON). Adding a rule requires no redeployment.
- Time-bucketed baseline
Weekday/weekend × night/morning/afternoon/evening. It catches out-of-hours collapses such as "PLE bottomed out at 02:00" without false-alarming on normal daytime swing.
- Early warning from score slope
Warnings like "declining · critical in ~14 days", before the problem grows.
- Neglect findings as first-class citizens
Stale statistics, regressed queries, end-of-support versions, overdue backups.
What is in the observation plane?
All read-only; none of it touches your user tables.
Server-specific remediation T-SQL
Not a static template: MAXDOP is computed from core and NUMA layout, Max Server Memory from total RAM. It is never executed automatically — it ships with a "display only" badge.
Baseline, anomaly and decline risk
A time-bucketed baseline catches out-of-hours collapses; the score slope estimates how long until the critical threshold.
SQL security audit — 15 rules
Whether audit is defined and actually running, sysadmin distribution, TRUSTWORTHY, public permissions, guest-enabled databases, orphan users, risky features, TDE. A configuration audit — not a network scan.
Query Store depth (2016+)
Plan regression (best → last avg duration ≥3x), duration variance (parameter sniffing), failed forced plans, a Query Store that silently dropped to READ_ONLY.
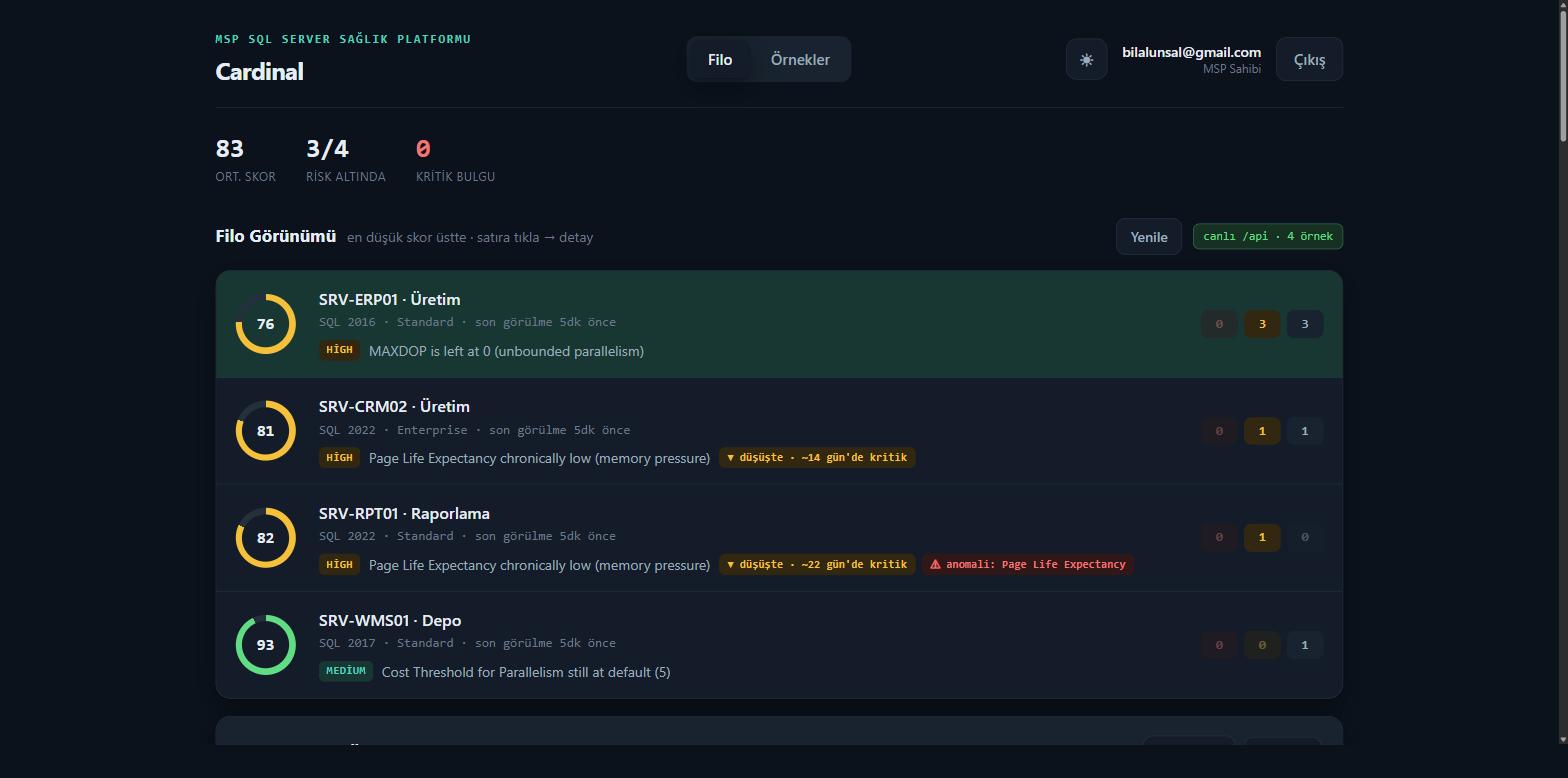
Fleet view and multi-tenancy
Many customers in one portal: lowest score on top, risk strip, early-warning and anomaly badges.
White-label PDF report
Cover and score band, executive summary, category breakdown, score history, all findings and remediation scripts. Branding is overridable — consultants deliver it under their own logo.
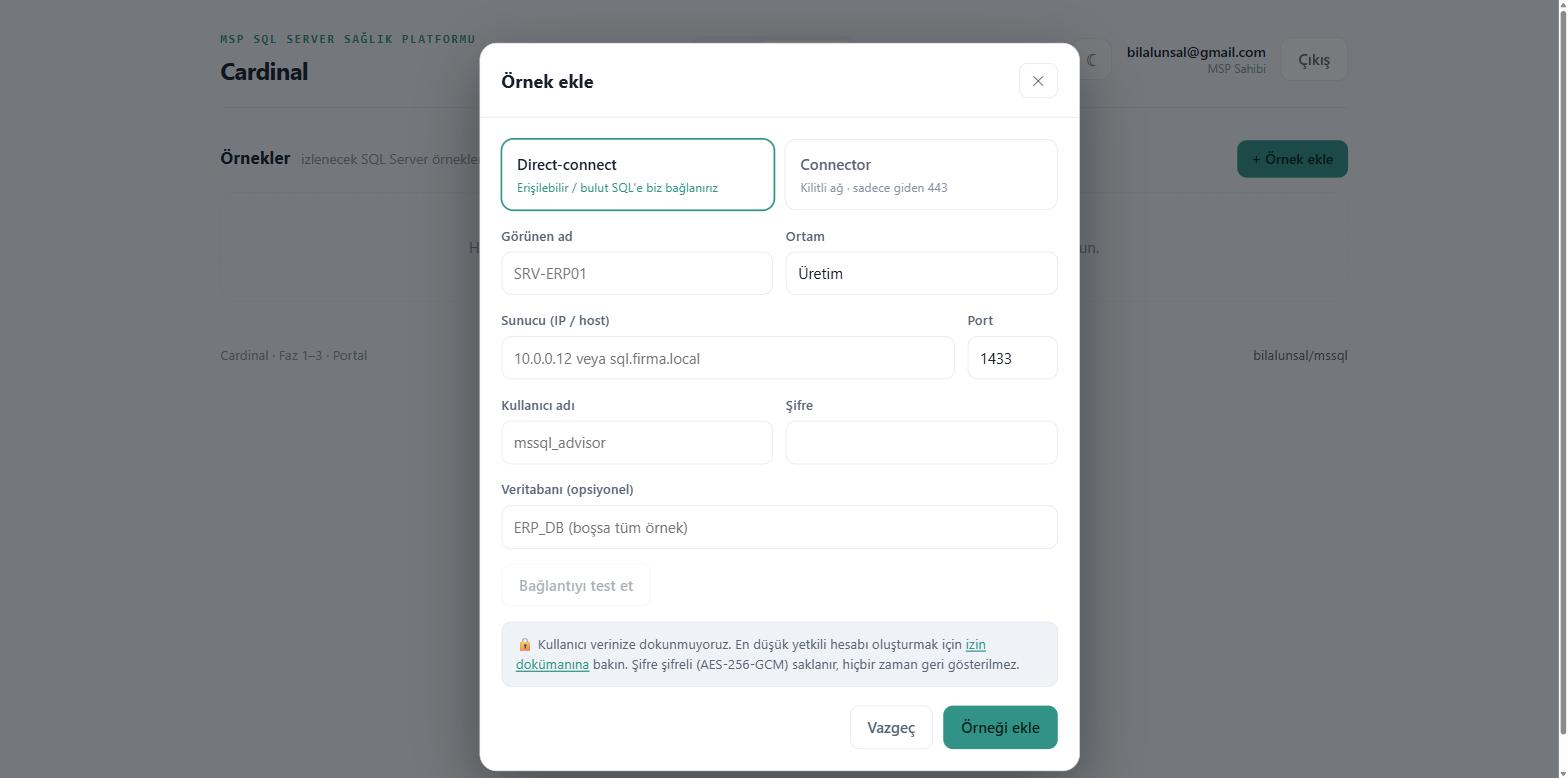
Setup, at least privilege
Two connection paths; neither has access to your user tables.
Direct-connect: enter IP, user and password in the portal. For locked-down networks, a connector — outbound 443 only, mTLS; credentials never reach our server.
Only VIEW SERVER STATE, VIEW DATABASE STATE and VIEW ANY DEFINITION. Passwords are stored AES-256-GCM encrypted and never shown back.
Repeats every 15 minutes by default; trend and baseline accumulate over time.
Findings and remediation scripts in the portal, plus a PDF report you can generate at any time.
A single client-ready PDF
Cover and score band, executive summary, category breakdown, score history chart, all findings by severity with remediation scripts, and a method/scope page. The sample below was produced with demo data.
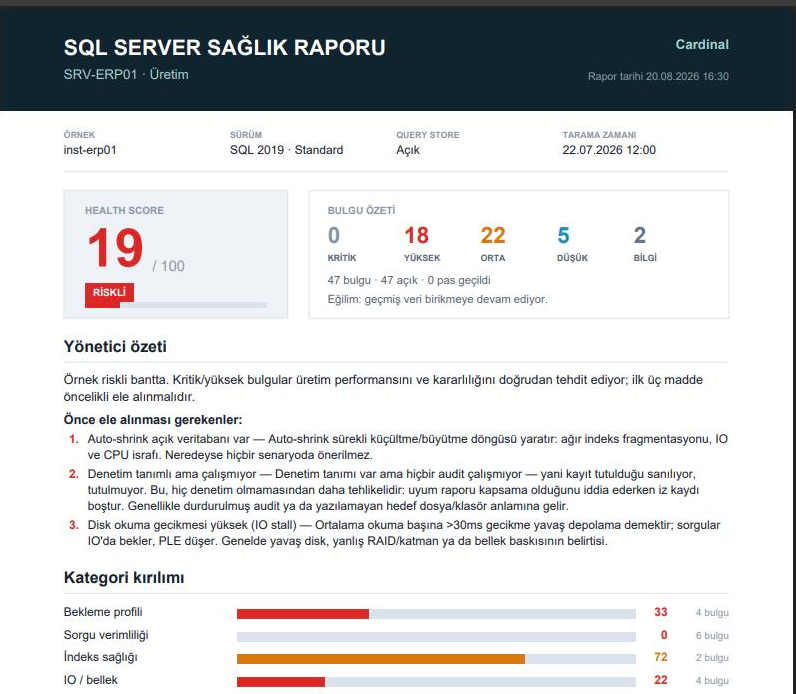
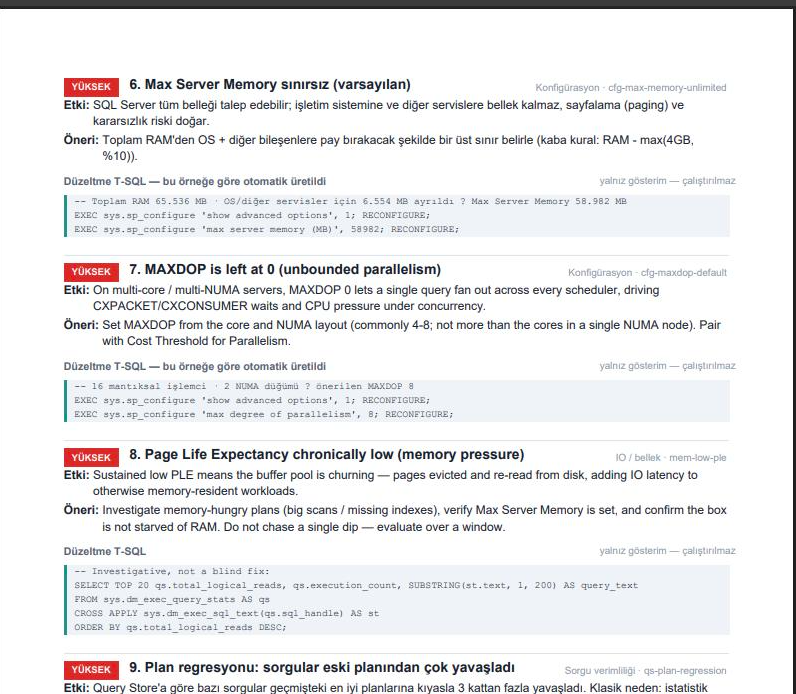
Download both sample reports now
Real 12-page output produced with demo data. No sign-up required.
One score, four different problems answered
A measurable score and a client-ready PDF report: the problem stops being a feeling and becomes a number.
Concrete, copy-paste remediation T-SQL — auto-generated for your specific server.
Evidence: which query, how many seconds, how many executions, how much saved.
Fleet view, multi-tenancy and a white-label report you deliver under your own brand.
Protection plane — inline, between the application and SQL
Unlike the observation plane, this module sits in the query traffic path. It is therefore a separate module with a separate process and separate approval, and it must run at the customer site. It is not generally available yet — talk to us about the pilot programme.
A security layer between the application and SQL Server; a matched query never reaches the database and the client receives an error.
Shadow mode is the default: it only reports what it would have blocked. Enforcement starts only after false positives are calibrated and you approve it.
It learns your application's normal query skeleton; a query structure never seen before raises a signal even with no matching signature.
Adding a new signature does not require reinstalling the system.
By default payloads are not logged, or are masked; what is retained is only the matched rule and metadata.
What happens if the proxy cannot reach a clean decision is chosen in writing: access first, or security first.
Protection you can verify. We do not claim the protection works — we prove it. We send real SQL injection attempts at your approved, isolated test environment and report which ones were stopped. Current coverage: 43 of 43 attack payloads blocked, zero false positives across 10 control queries. The simulation runs only with explicit written approval and only against targets flagged "isolated/test"; it will not run against a production-tagged instance even with full approval.
What mature monitoring tools do not do
Redgate SQL Monitor, SolarWinds DPA and SentryOne are mature products; depth and enterprise references are their strength. Their gaps lie elsewhere: they are not MSP-first, there is no local billing in Türkiye, and no white-label report.
Most importantly: they do not recommend how to rewrite the query. They say "this query is slow", not "write it like this." Cardinal is built exactly on that gap.
Who is it for?
Are you an ERP or software consultant?
When your client's SQL Server slows down, proving the cause falls to you. Let's talk about our partner model, where you deliver the Cardinal report under your own brand.
Cardinal — key facts
| Product name | Cardinal — MSP SQL Server health platform |
|---|---|
| Category | Microsoft SQL Server monitoring and advisory platform |
| Output | 0–100 SQL Health Score · query rewrite recommendations · remediation T-SQL · client-ready PDF report |
| Score components | 7 categories (wait profile, query efficiency, index health, IO/memory, configuration, maintenance, security/compliance) · 50 declarative rules |
| Query Advisor | 14 anti-pattern detectors · static analysis (never runs a live plan) · before → after with time estimate |
| Security audit | 15 rules · configuration audit (not a network scan) · read at least privilege |
| Access method | Direct-connect or connector (outbound 443 only, mTLS) · only VIEW SERVER STATE / VIEW DATABASE STATE / VIEW ANY DEFINITION · no user-table access |
| Scan frequency | Every 15 minutes by default · trend and baseline accumulate over time |
| Supported versions | SQL Server 2016 and later (Standard, Enterprise, Express) · reachable cloud SQL instances |
| Hosting | SaaS (default) or on-prem tier · portal port 31433 · passwords AES-256-GCM |
| Who uses it | Businesses running an ERP · IT teams without a DBA · ERP and software consultants · MSPs |
| Developer | Bilgi Teknoloji Danışmanlık — Istanbul, Türkiye |
Common questions about Cardinal
See your score, then decide
We run a scan on a single instance and produce your health score and first findings.